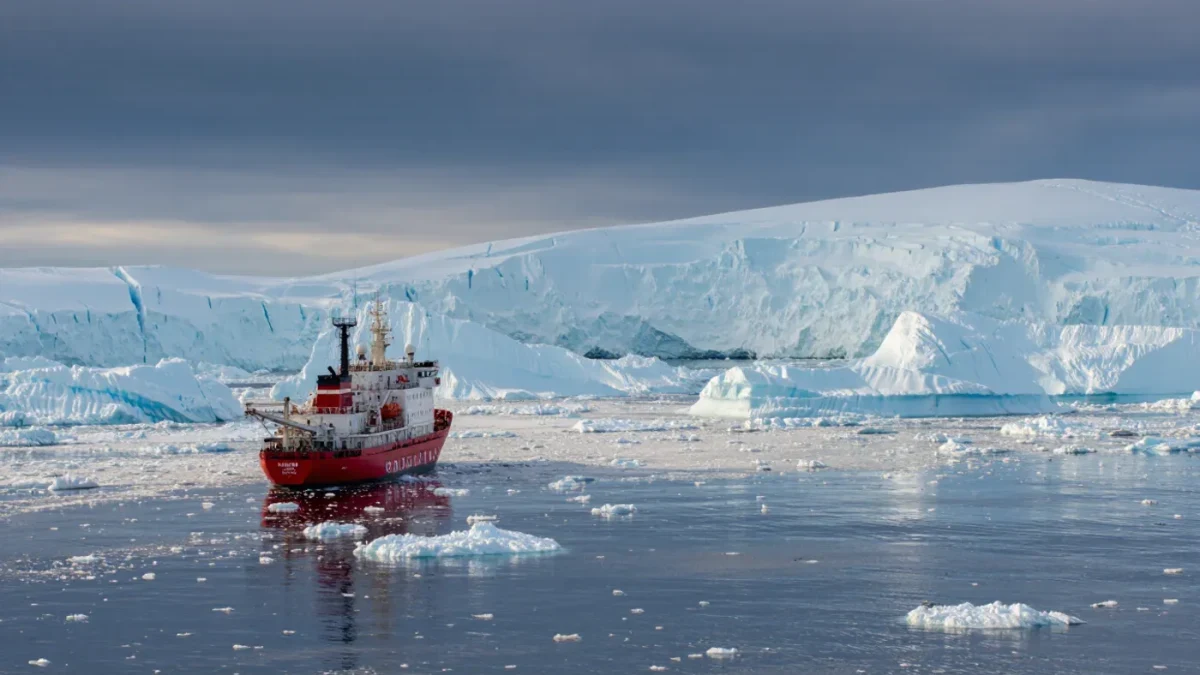
Satellites monitor Antarctica's ice shelves by measuring the height, motion, and radar backscatter of floating ice from orbit, and the record now spans decades. NASA's ICESat-2, launched in September 2018, fires green laser pulses and times their return to measure surface elevation to centimeter precision; Europe's Sentinel-1 radar satellites, flying since 2014, image the entire continent through cloud and polar night every few days. Together with predecessor missions, they show that several West Antarctic ice shelves — including those buttressing Thwaites Glacier — have thinned and retreated measurably since the 1990s, while most East Antarctic shelves have changed comparatively little.
What is an ice shelf, and why does its health matter?
An ice shelf is the floating extension of a land glacier — glacier ice that has flowed off the coast and now rests on the sea. Because it floats, its melting does not itself raise sea level, in the same way a melting ice cube leaves a glass of water unchanged. The shelf's importance is structural: it presses against embayment walls and pinning points on the seabed, holding back the land ice behind it.
Remove or thin the shelf and the glacier behind can accelerate, and that ice does raise sea level. West Antarctica is watched closely because much of its ice sits on bedrock below sea level, a configuration that some models allow to retreat in a sustained way once started. Whether that retreat has begun, and how fast, is precisely what satellite programs exist to measure.
How does each instrument see the ice?
The tools divide the work.
| Measurement | Instrument | What it shows |
|---|---|---|
| Laser altimetry | ICESat-2 (NASA, from 2018) | Surface elevation change — thinning rates — at ~80-meter spot spacing |
| Radar interferometry | Sentinel-1 (EU Copernicus, from 2014) | Ice velocity, grounding-line position, and shelf front movement |
| Radar sounding legacy | Predecessor campaigns (e.g., ESA ERS/Envisat) | Elevation trends since the 1990s |
| Mass change | GRACE and GRACE-FO gravity pairs | Total ice-mass loss from regional gravity shifts |
The grounding line — where ice last rests on rock before going afloat — is the number many researchers watch, because it marks the boundary between ice that can raise seas and ice that already does. Sentinel-1's radar can locate it by detecting tidal flexing in the ice.
What has the record shown so far?
Findings are attributed to the missions and groups that produced them. ICESat-2's early results, published beginning in 2019-2021, mapped extensive thinning on West Antarctic shelves, with the greatest losses near Thwaites and Pine Island. Studies combining decades of altimetry found some East Antarctic shelves gaining modest mass while West Antarctic ones lost it, consistent with changing ocean circulation delivering warmer water beneath the ice.
The ocean connection deserves emphasis: satellite data alone show the thinning, but the explanation — relatively warm deep water melting shelves from beneath — comes from shipboard and instrumented-seal measurements combined with the orbital record. The satellites see the symptom; the oceanography names the cause, with the usual qualifiers about regional wind patterns driving the currents.
Thwaites has drawn particular study, including joint U.S.-U.K. field programs reporting in 2021-2024 that warm water reaches beneath its floating tongue and that past retreat rates exceeded present ones. Its grounding zone has shifted over the satellite era, and iceberg calving has reshaped its ice front repeatedly, most visibly in events tracked by Sentinel imagery through 2021-2023.
How do we know the measurements are trustworthy?
Every technique carries stated uncertainties, and the literature is frank about them. Laser altimeters must separate ice-surface lowering from snowfall changes — fresh snow adds height without adding ice — so researchers model density. Radar velocities are cross-checked against GPS stations planted on the ice. Gravity measurements resolve broad regions, not individual glaciers, and merge smoothly only with modeling. Reanalysis by independent teams — for example, the multi-decade mass-budget exercises known by their program acronyms — agree within stated error bars on the sign of the trend for West Antarctica: loss.
Claims that reach further than the instruments — collapse timetables for Thwaites spanning centuries on the optimistic end, much faster on pessimistic modeled scenarios — come from model studies, not from direct observation, and the papers involved label their scenarios as such.
What did 2022-2025 add to the picture?
The most-watched events of recent years were calvings and thinning at the cold end of the continent. The shrinking of Larsen C's neighbors decades ago already showed that even thick shelves can lose integrity quickly; more recent Sentinel imagery tracked large bergs shedding from Thwaites' eastern tongue and from the Brunt system, while multi-mission analyses reported that a distinct subset of East Antarctic shelves also began thinning in the 2010s — a reminder that 'East Antarctica stable' is a simplification the record does not fully support. None of these events proves a runaway; each contributes data points to the mass budgets the assessment reports aggregate.
What comes next in orbit?
The measurement network is being extended rather than replaced. Sentinel-1's follow-on units are planned within Copernicus; NASA's ICESat-2 continues operating well past its design life, with its predecessor ICESat record bridging the 2003-2009 era; and the joint U.S.-Indian satellite NISAR, launched in 2024, adds a new radar interferometry capability relevant to ice velocity. The result is a lengthening, self-consistent record — which is what distinguishes a measured trend from an anecdote, and why the sea-level assessments that cite these programs update their numbers on fixed cycles rather than after each new image.