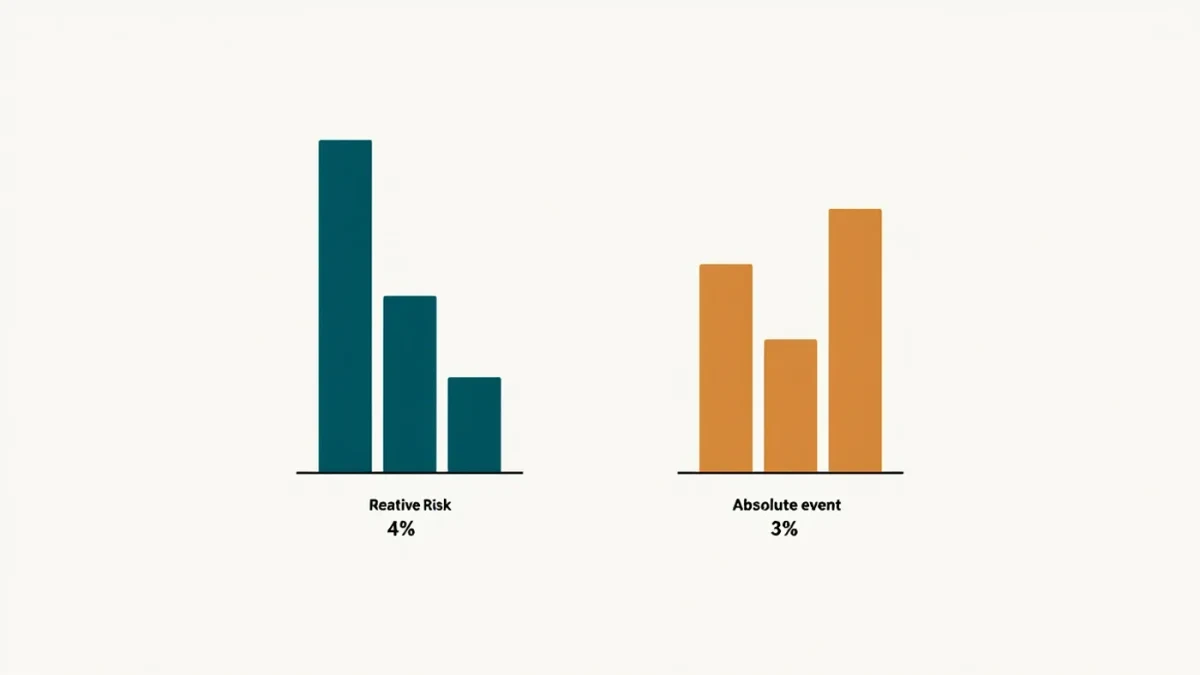
Effect size is a measure of how large a difference or association actually is, separate from whether it clears the threshold of statistical significance. The SPRINT blood pressure trial, published in The New England Journal of Medicine in 2015, reported both readings at once: about a 25 percent lower relative rate of cardiovascular events under intensive treatment, but roughly a one percentage point difference in absolute risk over about three years. Same trial, same data, two very different numbers.
This is an explainer about research statistics, not medical guidance, and it should not be used to make treatment decisions; those belong with a clinician.
What does statistical significance leave out?
A significance test answers a narrow question: how surprising would these data be if the true effect were zero? A p-value below 0.05, the conventional cut, is commonly read as passing that test. But the p-value says nothing about magnitude. A trivial difference, measured in a large enough sample, will eventually become statistically significant, and a substantial difference in a small sample may miss the threshold entirely.
The American Statistical Association made the point formally in a 2016 statement, warning that p-values do not measure the size of an effect or the importance of a result. In 2019, three statisticians writing in Nature, with more than 800 co-signatories, called for abandoning claims that a result is significant or non-significant altogether. The larger a study grows, the more significance reflects sample size rather than practical importance.
How is effect size expressed?
There is no single effect size statistic; there are families of them, matched to the kind of question a study asks. For differences between groups, researchers use standardized measures such as Cohen's d, which expresses a gap in units of variability, or the simpler difference in proportions. For risk, the split between relative and absolute measures matters most. For associations, correlation coefficients describe how tightly two measurements travel together.
- Absolute risk difference subtracts the event rate in one group from the other, for example 4 percent versus 3 percent, a 1 percentage point difference.
- Relative risk divides one rate by the other, turning the same data into a 33 percent increase, which sounds far more dramatic.
- Number needed to treat converts the absolute difference into how many patients must receive the intervention for one to benefit.
- Standardized measures such as Cohen's d allow comparisons across studies that used different scales.
Why can relative and absolute numbers tell different stories?
Because relative change depends on the baseline. Doubling a risk from 1 in 10,000 to 2 in 10,000 is a 100 percent relative increase that almost no one would act on; the same doubling from 3 in 10 to 6 in 10 is a clinical earthquake. Headlines almost always carry the relative figure, because it is larger and cleaner. Reading a study, the move that matters is finding the absolute event rates in each group and subtracting them by hand.
The SPRINT figures show the pattern. A roughly one percentage point absolute reduction in major cardiovascular events over roughly three years, in a high-risk population, translated into a meaningful number needed to treat; in a low-risk population the same relative effect would have produced a far smaller absolute benefit. Effect size, unlike significance, forces the question of for whom.
| Measure | Question it answers | Typical pitfall |
|---|---|---|
| P-value | Is the finding compatible with no effect? | Says nothing about how large the effect is |
| Absolute risk difference | How many more events in one group? | Can look small next to relative claims |
| Relative risk | How do rates compare proportionally? | Inflates rare-event findings |
| Number needed to treat | How many treated for one to benefit? | Depends on baseline risk and time frame |
| Cohen's d | How big is the gap in shared units? | Benchmarks (small, medium, large) are field-specific |
What does a small significant result actually mean?
It usually means a large sample found a real but modest effect. Large trials and pooled analyses routinely produce significant p-values alongside differences too small to matter for an individual. This cuts both ways: a small study with a strikingly large effect size deserves suspicion too, because small samples overestimate magnitude more often than large ones, a phenomenon related to what methodologists call the winner's curse. Precision about magnitude, not just existence, is what separates a useful finding from a statistical artifact.
How do we know which number to trust?
The habit is to ask three questions of any reported result. First, what is the absolute difference between groups in real event rates? Second, over what period and in what population, since a percentage point means different things in high- and low-risk groups? Third, what does the confidence interval around the effect size look like, because a wide interval means the estimate itself is unstable? The 2016 American Statistical Association statement and the 2019 Nature comment both pressed researchers to report effect sizes with intervals rather than significance labels alone, and well-reported studies now do.
Where a study reports only a relative change, a reader can often reconstruct the absolute figures from the results tables. If the raw event rates are absent, the finding is hard to interpret no matter how significant it appears.
Does a large effect size guarantee importance?
No, and it sometimes signals weakness instead. Genuine large effects from small studies deserve replication before belief; effects that shrink as samples grow are a recognized signature of initial overestimation. Context sets the bar: a tiny absolute reduction can matter greatly for a common and serious outcome, while a large effect on a mild, self-limiting symptom may matter little. Effect size supplies the measurement; importance is a judgment about consequences, made in plain numbers rather than p-value thresholds.