Study A says coffee helps you live longer. Study B says it does nothing. Both made the news. Both looked at thousands of people. So why do they disagree? Often the problem is not the data. It is the comparison hiding underneath it.
Researchers compare groups all the time. Smokers against non-smokers. One diet against another. One company's trucks against another's. A comparison is only fair when the groups differ in the thing being studied, and in nothing else. When a hidden third factor differs too, the study is quietly comparing apples to oranges. For related coverage, see Why one study is never the last word.
Meet the confounder
Statisticians have a name for that hidden factor: a confounder. In plain terms, it is something that shapes both the thing being compared and the outcome being measured. Wikipedia's article on confounding calls confounding a form of systematic error. It can distort what observational studies seem to show about cause and effect.
This is why "correlation does not imply causation" is more than a slogan. A link between two things can be real. Or it can be manufactured by a third factor nobody accounted for. Failure to control for a confounder results in a spurious association between exposure and outcome. The numbers are honest. The story wrapped around them is not. We covered a connected angle in Why correlation is not causation in headlines.
A trucking tale that makes it click
Wikipedia offers a clean example. A trucking company compares the fuel economy of trucks from two makers. It tracks miles per gallon over one month. Trucks from maker A look more fuel-efficient. Case closed? Not quite. The A trucks were more often assigned highway routes. The B trucks spent more time in the city.
Route type affects fuel economy, and route type differs across the two makers. So the gap likely reflects highway driving versus city driving, not truck quality. The comparison looked fair. It was not. The fix would be simple. Give both makers the same mix of routes. Or track the two kinds of driving apart. Swap trucks for diets, routes for lifestyles, and fuel economy for health outcomes. You now have the shape of many health headlines.
Warning signs a reader can spot
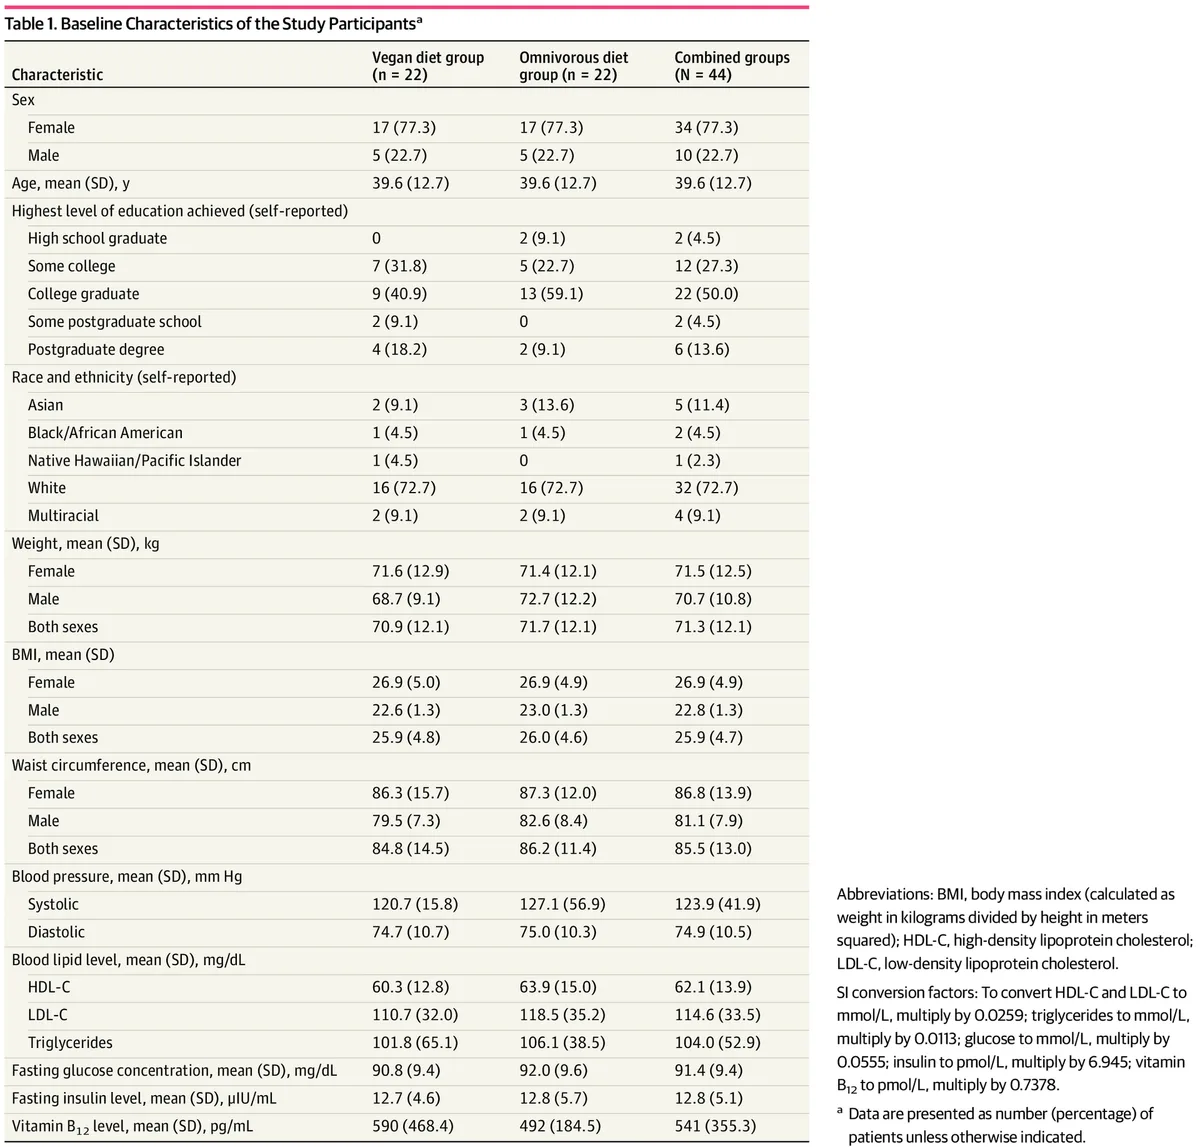
You do not need a statistics degree to catch a weak comparison. Ask a few questions. Were the two groups similar to start with? Could something besides the treatment explain the gap? Who ended up in each group, and did they choose it themselves?
That last question matters more than it sounds. Wikipedia's entry on selection bias explains how non-random picks can change the link between an exposure and an outcome. Among the people studied, that link can look different than it does among everyone else who was eligible. Volunteer bias is one everyday version of the problem. People dropping out of a study is another. A fair study tells you how it picked its people. A vague one often has a reason to be vague.
What fair comparisons look like
Good research expects the problem before the data arrives. Careful study design, randomization, and statistical adjustment all exist to separate real effects from spurious ones. When researchers cannot randomize, they must measure the factors that could tip the scales and account for them. The strongest studies tell you exactly which factors they controlled and how.
Conclusion: ask what else was different
An apples-to-oranges study is not usually a lie. It is usually an oversight. A hidden factor shaped the groups before anyone counted a single result. Your defense is one habit. Whenever you meet a bold claim, pause and ask what else might differ between the groups. If the answer is nothing, the comparison deserves your attention. If the answer is plenty, and nobody mentioned it, you have spotted an orange wearing an apple's name tag.