A meta-analysis combines the numerical results of multiple studies of the same question into one weighted estimate, giving more influence to studies with more information. It is the statistical half of a systematic review, which first searches, screens and appraises every study it can find under a declared protocol. The method's modern scale shows in its reporting standard: the PRISMA 2020 statement, an update coordinated in 2021, prescribes a 27-item checklist for systematic reviews. Pooling sharpens a set of noisy estimates into one more precise number, when its assumptions hold.
This article explains a research method. It offers no medical guidance, and pooled averages should inform decisions only together with a clinician.
How does pooling actually work?
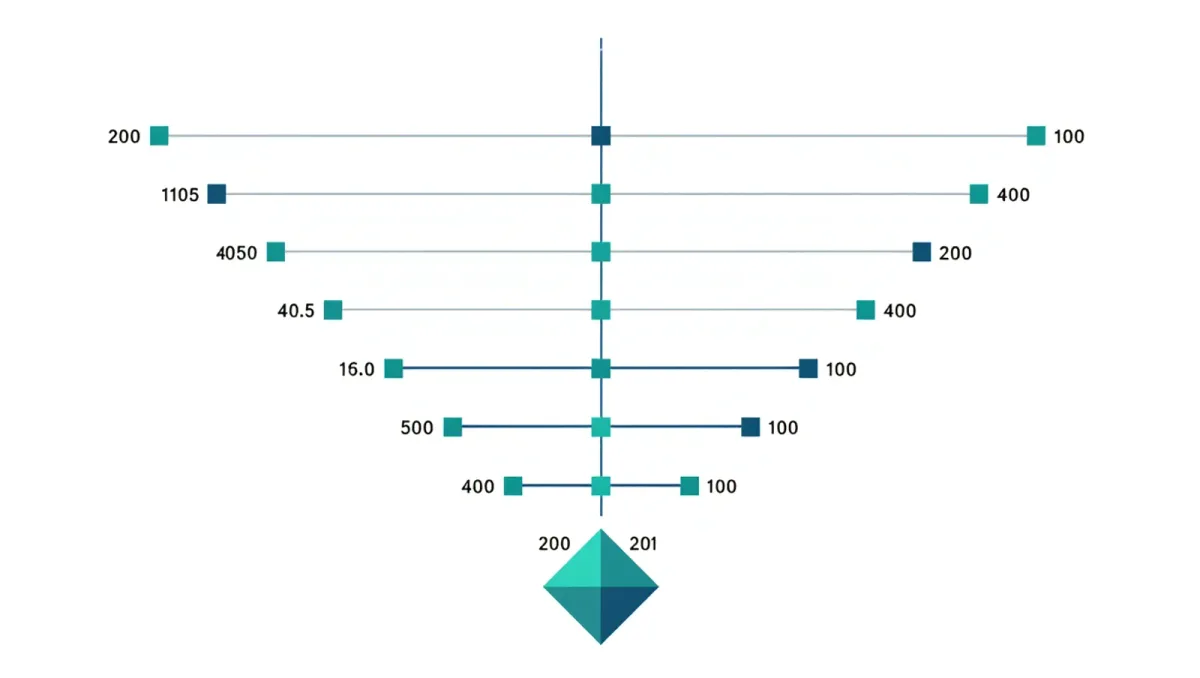
Each study contributes an effect estimate, a risk ratio, a difference in means, whatever the question requires, together with a measure of its uncertainty. The meta-analysis then weights each study, most commonly by inverse variance, so precise large studies move the pooled estimate more than small noisy ones. The result is usually drawn as a forest plot: one row per study, a square sized by weight, a line for its confidence interval, and a diamond at the bottom summarizing the whole.
Two statistical models compete to do the summarizing. A fixed-effect model assumes every study estimates one true underlying value, and observed differences are sampling noise. A random-effects model assumes the true effect varies between studies, by population, dose or setting, and aims to estimate the average of that distribution. Random-effects models fit most real literatures better, and they produce wider, more honest intervals.
What can a meta-analysis show that single studies cannot?
Its first gift is precision. Many trials of the same therapy are individually too small to settle anything; pooled, their patients add up to an answer none could give alone. The second is pattern: with enough studies, analysts can test whether the effect differs by dose, population or study quality, something no single trial spans. The third is a map of the evidence itself, showing where studies cluster, where they disagree, and where no one has looked.
The method also formalizes disagreement. Instead of arguing about which trial to believe, reviewers quantify heterogeneity, the variation in effects beyond chance, commonly with a statistic called I-squared that expresses what share of variation is real rather than noise. High heterogeneity is a finding, not a nuisance: it says the question has more than one answer.
| Component | What it does | Where it can mislead |
|---|---|---|
| Search strategy | Finds all eligible studies, published or not | Missed literature skews the pool |
| Eligibility criteria | Defines which studies qualify | Too strict: too few; too loose: apples with oranges |
| Risk-of-bias appraisal | Rates each study's design quality | Ignored when pooling |
| Pooling model | Produces the weighted estimate | Fixed-effect assumptions rarely hold |
| Heterogeneity statistics | Quantify disagreement | Treated as noise instead of signal |
What can go wrong on the way in?
The old summary is garbage in, garbage out, and the failure modes are specific. Publication bias, the tendency of significant results to reach print while null results vanish, bends the pool toward positive findings. Reviewers check for it with funnel plots, which arrange studies by precision and effect size; an asymmetric funnel, a missing corner where small null studies should sit, is a warning. Duplicate publication, the same trial reported twice, counts patients twice. And selective reporting inside studies, highlighted outcomes quietly dropped, corrupts estimates in ways no list of titles reveals.
The deeper limit is combinability. Studies with different populations, doses, durations and outcome definitions may not estimate a common quantity at all, and averaging them produces a number with no referent. Good reviews state in advance what counts as similar enough, and hesitate when the spread of results exceeds chance.
How do we know whether to trust a pooled estimate?
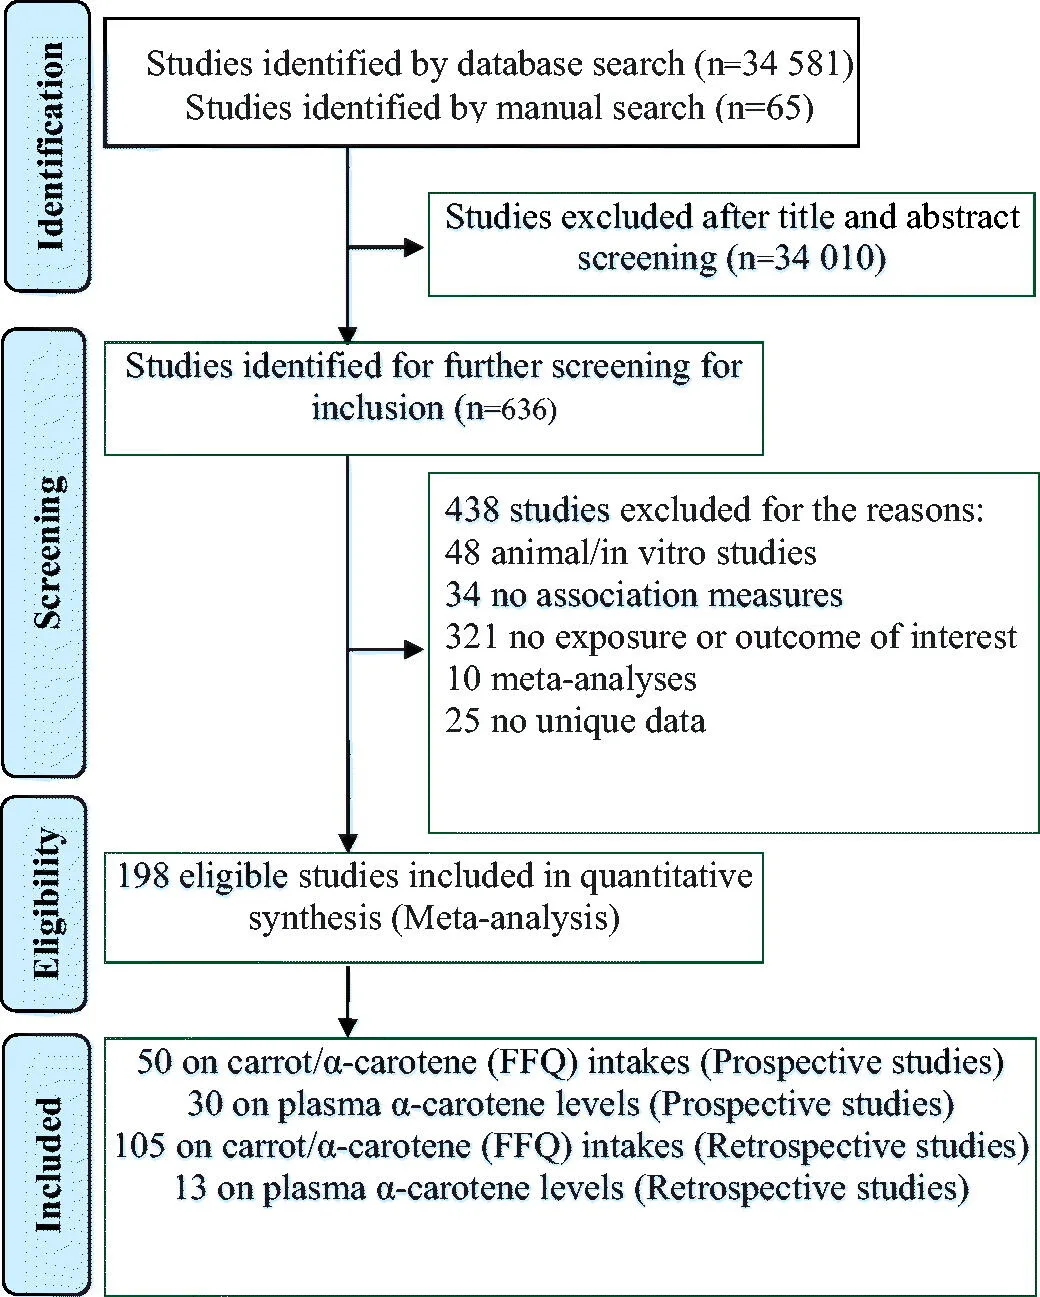
A reader's audit takes four steps, and the PRISMA 2020 reporting guideline exists largely to make them possible. Check that the search covered multiple databases and trial registries, not only published journals. Check the flow diagram, which counts records screened, excluded and included, and whether the included studies actually match the question. Check the risk-of-bias appraisal, and whether it influenced the analysis, not just the appendix. Check the forest plot for both the pooled diamond and the spread of studies around it; a tight cluster around a clear diamond is reassuring, and a fan of contradictory rows beneath a confident diamond is not.
The Cochrane network, founded in 1993 and named for epidemiologist Archie Cochrane, whose 1972 book pressed medicine to summarize evidence systematically, remains the best-known producer of such reviews, with methods manuals that many other organizations copy. Its reviews publish protocols first, which lets readers see whether the finished review moved its own goalposts.
When is a meta-analysis the wrong tool?
When there is nothing worth pooling. Two small biased studies yield a precise-looking pooled estimate of a bias. When heterogeneity is extreme, when the studies measure different things, or when the entire pool descends from one research group, a narrative review that maps the disagreement serves readers better than a false summary number. And a meta-analysis of observational studies inherits every confounder its studies carried, so causal language in such reviews deserves particular suspicion.
Used with discipline, the method is one of the most useful instruments in evidence-based medicine: an honest ledger of what has been tried, how precisely, and with what agreement. Used as a machine for manufacturing certainty, it is arithmetic in a lab coat.